CannyLab Simulator
- General description
- Enabling simulator mode
- Continuous diagram execution
- Pause and reset
- Conditional pause
- Forcing values
- Changing display value format
- Composite blocks in simulator mode
General description
Simulator mode is the secondary operating mode of CannyLab, used for simulating and debugging diagrams without the need for a controller.
In this mode CannyLab simulates the operation of a CANNY controller by performing compute actions on the function diagram that are equivalent to compute actions that would be performed by a controller.
You can simulate the execution of a function diagram at any stage of development. The simulator has a number of functions that help with this:
- you can run the diagram on a per-cycle basis;
- you can execute the diagram step-by-step;
- you can set a number of conditions to suspend the execution;
- you can force both input and output values;
- you can set a watchpoint for intermediate value changes.
Note: The current CannyLab simulator version doesn’t support controller hardware resources, so the results of reads/writes from/to controller memory in the simulator may differ from the results obtained when the diagram is executed by a real controller.
Enabling simulator mode
Enabling and disabling the simulator mode is done by selecting the appropriate item in the «Simulator» submenu in the menu bar, or by pressing the “Turn On” button in the toolbar.

The layout of the application changes when entering simulator mode. Control elements unavailable in this mode are replaced with ones specific to simulator mode, debugging information is added to the diagram.

When simulator mode is activated, a consistency check is performed on the diagram. Then the amount of random access memory (RAM) and program memory (ROM) that the controller needs to run this diagram will be calculated. You will see a warning or error message if any issues are found.
The function block execution order is automatically detected and displayed. All intermediate values of inputs and outputs of function blocks, function block internal memory and the value of all the networks is reset to 0. The pointer to the next block in the execution queue is set to the first block of the diagram. Simulation timescale is bound to real time.
You can freely browse the diagram and zoom in and out, however you cannot edit any elements in simulator mode.
Continuous diagram execution
Continuously execute the diagram within the simulator by selecting «Run» → «Start» in the main menu or click the “Run” button on the toolbar.

The Run button turns into a Pause button when the diagram is running:

Note: The items “Run” and “Pause” in the submenu “Simulator” and the corresponding Run and Pause buttons on the toolbar both serve to activate the same functionality, it doesn’t matter which one you use.
Bind the simulator clock to realtime by pressing the Realtime button:

This functionality is enabled by default. When the simulator clock is bound to real time it will start the countdown for the diagram execution loop at the speed of the PC system clock. If the simulator clock is not bound to real time, it will run as fast as possible, with the maximum speed being determined by performance of your PC.
Change diagram timescale by changing the value in the «Execution loop duration» field on the toolbar:

The diagram timescale sets the increment that will be added to the simulator clock after each loop of the diagram. Essentially, this parameter determines the time the controller takes to perform one full execution of the diagram.
Note: When debugging large user diagrams implementing time-sensitive algorithms, it’s recommended to add 1ms to the timescale for every 30 function blocks present on the diagram. This recommendation applies to PLC CANNY 7, other controllers may require a different timescale.
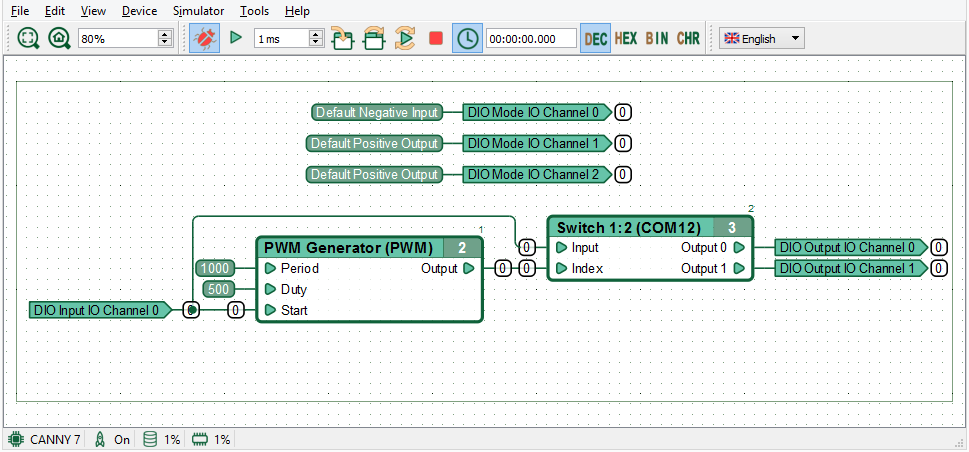
When function block input and output values are changed during thze execution of the diagram, their new values are displayed on the diagram right beside the input or output. For the sake of visual clarity, networks with non-zero values will be highlighted.

If an Input or Output register is connected to a function block at a distance of at least two squares of the network grid, the values will be displayed like this:

The same applies to External Input/External Output diagram elements used in Composite blocks:

Pause and reset
Pause the execution of the diagram within the simulator by selecting «Simulator» → «Pause» in the menu bar or clicking the Pause button on the toolbar.

Pause button will turn into the Run button when pressed:

The specific function block at which the execution of the diagram was suspended is highlighted in yellow. Networks, whose values changed at the last step are also highlighted and the simulator clock is stopped.

Starting with CannyLab v2 the workspace display port will shift to show the block the execution was paused at.
Continue diagram execution at the point where it was suspended by selecting «Simulator» → «Run» in the menu bar or by clicking the Run button on the toolbar.
Stop the diagram execution and reset the simulator to its initial state by selecting the Simulator -> Reset item in the menu bar or by clicking the Reset button on the toolbar.

Conditional pause
You can pause diagram execution based on the following conditions:
- when the value of a particular network on the diagram changes (watchpoint);
- when the next function block is executed (step mode);
- before execution of a specific function block on the diagram (breakpoint);
- on completion of a full cycle of the diagram (full loop).
Loops and stepwise execution
Execute the next function block and immediately suspend the diagram afterwards by selecting Simulator -> Step Into/Simulator -> Step Over in the menu bar or the respective buttions


The difference between these two options is how they interact with Composite blocks: - Step Into steps into the composite block and pauses the execution within its internal diagram, allowing you to execute the internal diagram step by step; - Step Over executes the composite block as if it were any other function block and pauses the execution in the main diagram.
Perform one full loop of the diagram, with the execution being suspended at the currently selected funciton block, by selecting Simulator -> Full loop in the menu bar or pressing the appropriate button on the toolbar.

Breakpoints
Set or remove a breakpoint at a specific function block by selecting the appropriate context menu item, available when right-clicking any function block. Header background of the function block that was declared a breakpoint will be highlighted in red in simulator mode.

This can also be done by double-clicking a function block’s header while holding down CTRL.

The diagram execution will be suspended before each breakpoint, if any exist on the diagram.
Remove all existing breakpoints by selecting the appropriate context menu item, available when right clicking a free spot in the workspace.

Note: All set breakpoints are saved between simulator sessions.
Watchpoints
Watchpoints are set on diagram networks.
Set or remove a watchpoint at a specific network by selecting the appropriate context menu item, available when right-clicking any segment. All network segments that were declared as watchpoints are highlighted in red in simulator mode.

The diagram execution will be suspended every time a value changes in a network with a watchpoint.
You can also set or remove a watchpoint by double-clicking the network segment in simulator mode.
A watchpoint can also be set on an Output register or composite block external output. The execution will be suspended whenever one of those values changes.

Remove all existing watchpoints by selecting the appropriate context menu item, available when right clicking a free spot in the workspace.

Note: All set watchpoints are saved between simulator sessions.
Forcing values
To simulate external influences on the diagram during simulation, you can force an arbitrary network value in simulator mode.
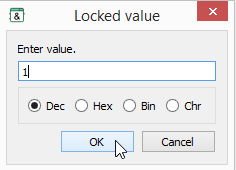
You can force an arbitrary value by selecting the context menu item Lock value, available when right-clicking any network segment or input register.

This will open up a dialog, letting you set the desired value.

A locked network value is displayed as white text on black background.

This value will be used instead of the network’s real value by all connected function blocks until the value is unlocked or you exit simulator mode.
Note: Unlike break- or watchpoints, locked values are not saved between simulator sessions.
Unlock the value by right-clicking the desired element and selecting the Unlock value item.

Unlock all values by selecting the appropriate context menu item, available when right clicking a free spot in the workspace.

Quickly lock the value of a network to 1, or quickly unlock the network value by double-clicking the left mouse button on a network while holding down the «Ctrl» key.

Changing display value format
By default, all values are displayed in the simulator in the decimal system. The numeral system used for displaying values can be changed at any time by selecting the item «Simulator» → «Values Format» in the menu bar or by clicking the appropriate button on the toolbar.

Composite blocks in simulator mode
While continuously executing the diagram you can follow the process of execution on any level of the nesting hierarchy.
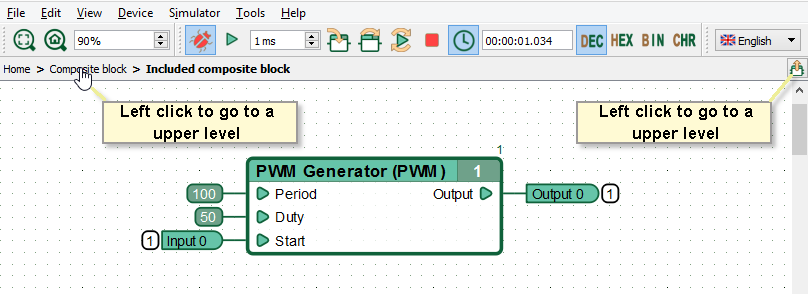
Move between the levels of the hierarchy just like you would in editor mode.
Example of navigation:

Let’s go one level up the hierarchy, to the first composite block:

Now let’s finally move to the function diagram proper:


